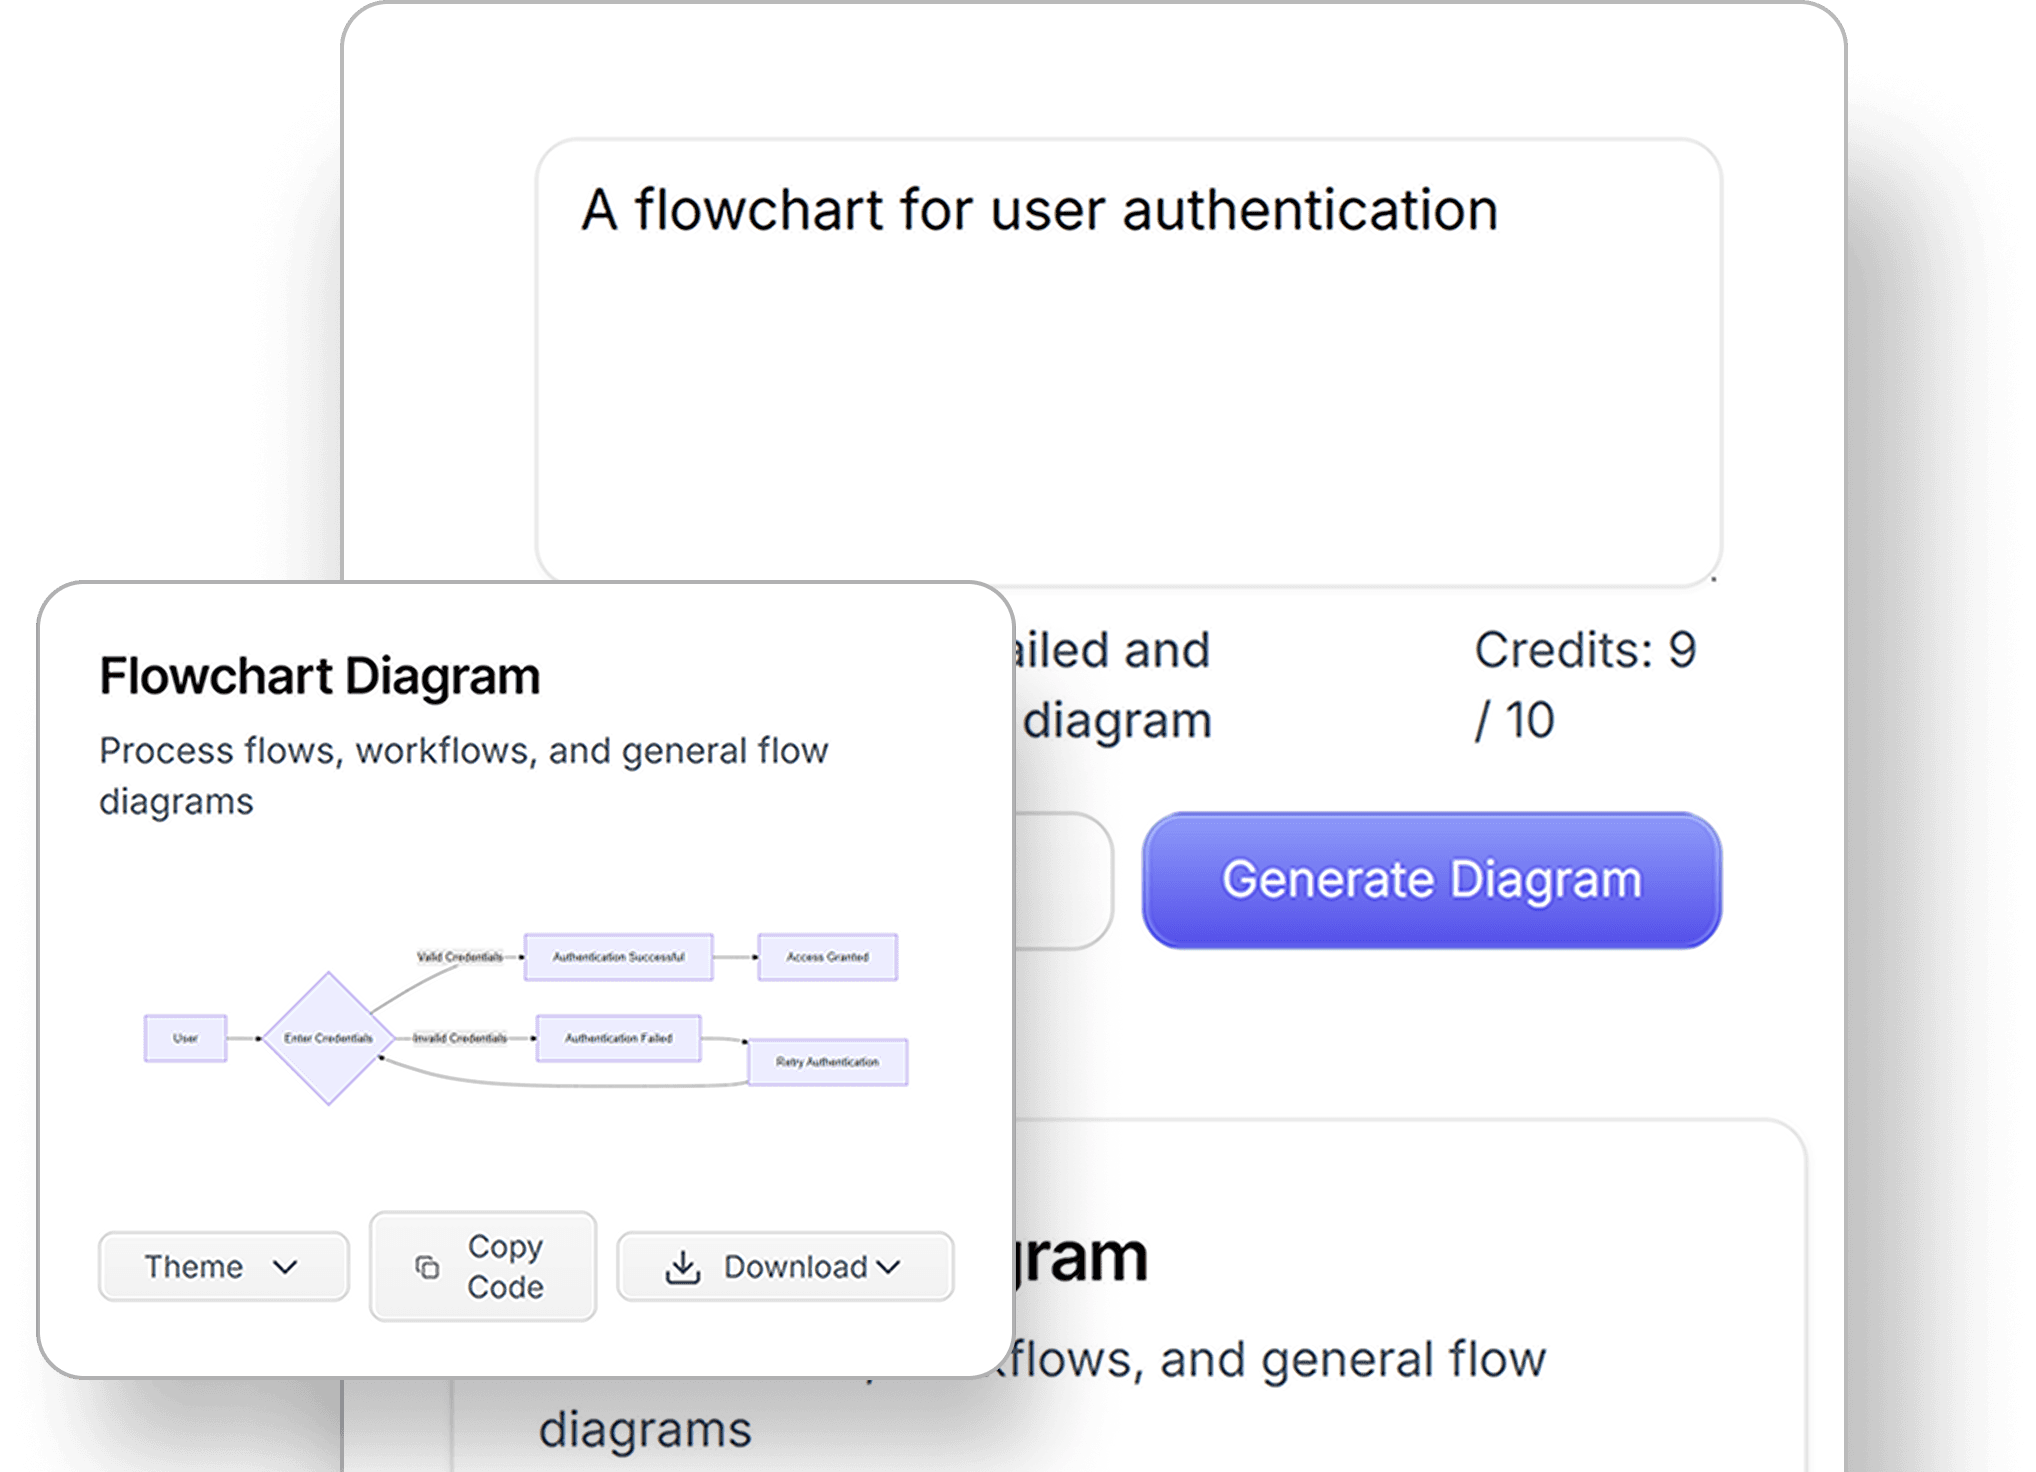
AI-Powered Diagramming: Why AutoDiagram Outperforms Traditional Tools


AI-Powered Diagramming: Why AutoDiagram Outperforms Traditional Tools

Table of Contents
- The Limitations of Conventional Diagram Software
- The AI Advantage in Visual Documentation
- Technical Deep Dive: AutoDiagram's Architecture
- Head-to-Head: AutoDiagram vs Competitors
- Future Roadmap: What’s Next for AutoDiagram?
- User Success Stories
- FAQs
- Conclusion
1. The Limitations of Conventional Diagram Software
The Hidden Costs of "Standard" Tools
A 2024 Gartner report identified key pain points in traditional diagramming platforms:
-
Productivity Drain:
- 63% of users spend >30 minutes aligning boxes manually
- Average 12 clicks needed to create a simple flowchart node
-
Collaboration Challenges:
- 78% of teams use email/Slack for diagram feedback
- 54% report version conflicts in critical documents
-
Technical Debt:
- 41% of outdated diagrams in enterprise knowledge bases
- 33% of system outages linked to inaccurate architecture maps
Case Study: Enterprise Software Migration Disaster
Situation:
A Fortune 500 company attempted to document cloud infrastructure using legacy tools:
- 6-month project duration
- 23-team member involvement
- $850k budget
Outcome:
- 47% of diagrams contained conflicting information
- 3 failed compliance audits
- Project abandoned after 9 months
AutoDiagram Solution:
- Completed in 6 weeks with 98% accuracy
- Real-time team validation
- Automatic Azure/AWS asset sync
2. The AI Advantage in Visual Documentation
How AutoDiagram’s AI Rewrites the Rules
Neural Diagram Generation Process
-
Input Analysis
- Natural language processing (NLP)
- Technical jargon recognition
- Contextual intent detection
-
Knowledge Graph Construction
# Simplified knowledge graph creation entities = detect_entities(user_input) relationships = identify_relationships(entities) graph = build_knowledge_graph(entities, relationships) -
Visual Optimization
- Force-directed layout algorithms
- Color contrast accessibility checks
- Responsive design principles
-
Continuous Learning
- User feedback loop integration
- Domain-specific pattern recognition
- Style preference retention
Quantifiable Benefits of AI Diagramming
| Metric               | Manual Tools | AutoDiagram | Improvement |
|----------------------|--------------|-------------|-------------|
| Creation Speed       | 2.7 hrs      | 8.4 mins    | 1,830%      |
| Collaboration Efficiency | 34%      | 89%         | 162%        |
| Version Accuracy     | 72%          | 98%         | 36%         |
| User Satisfaction    | 6.2/10       | 9.4/10      | 52%         |
3. Technical Deep Dive: AutoDiagram’s Architecture
System Overview

Core Components
3.1 Natural Language Processing Engine
-
Transformer Models:
- Fine-tuned BERT for technical text
- 48-layer neural network
- 1024-token context window
-
Multi-Stage Processing:
- Tokenization (word-piece)
- Semantic role labeling
- Entity-relationship extraction
- Diagram type classification
3.2 Machine Learning Models
-
Computer Vision Integration:
- CNN-based layout prediction
- GAN-assisted styling (10+ preset design systems)
- Object detection for image imports
-
Key Algorithms:
Layout Engine: ForceAtlas2 + Barnes-Hut optimization
Style Transfer: AdaIN neural networks
Error Detection: Graph neural networks (GNNs)
3.3 Collaboration Framework
-
Real-Time Features:
- Conflict-free replicated data type (CRDT)
- 50ms sync latency
- Granular revision history
-
Security:
- AES-256 encryption
- SOC 2 Type II compliance
- GDPR-ready data controls
4. Head-to-Head: AutoDiagram vs Competitors
Feature Comparison Matrix
| Feature                  | AutoDiagram | Lucidchart | Visio      | Draw.io    |
|--------------------------|-------------|------------|------------|------------|
| AI Text-to-Diagram       | ✓           | Limited    | ✗          | ✗          |
| Real-Time Collaboration  | ✓           | ✓          | Partial     | ✓          |
| Automatic Error Checking | ✓           | ✗          | ✗          | ✗          |
| Version History          | Unlimited   | 30 days    | 90 days    | 7 days     |
| API Access               | REST/GraphQL| REST       | None       | Limited    |
| Custom Templates         | ✓           | ✓          | ✓          | ✗          |
| Pricing (Team/Seat)      | $15         | $18        | $22        | $8         |
Performance Benchmarks
Test Scenario: Generate AWS architecture diagram from 500-word description
| Platform      | Time  | Accuracy | Revision Rounds |
|---------------|-------|----------|------------------|
| AutoDiagram   | 2:18  | 94%      | 0.7             |
| Lucidchart    | 22:41 | 68%      | 3.2             |
| Visio         | 41:12 | 52%      | 4.8             |
| Draw.io       | 33:55 | 61%      | 2.9             |
5. Future Roadmap: What’s Next for AutoDiagram?
2024-2025 Innovation Pipeline
Q3 2024
-
3D Diagram Support
- WebGL-based rendering
- VR/AR compatibility
-
Code Reverse Engineering
- Generate architecture maps from GitHub repos
- CI/CD pipeline visualization
Q4 2024
-
Voice-to-Diagram
- Real-time meeting transcription
- Automated mind mapping
-
Predictive Modeling
- Infrastructure scaling simulations
- Load testing visualizations
2025 Vision
-
Auto-Maintained Documentation
- Synced with live systems
- Change impact visualizations
-
AI Design Partner
- Proactive optimization suggestions
- Regulatory compliance checks
6. User Success Stories
Global Logistics Company: 83% Process Acceleration
Challenge:
- 14 warehouses with inconsistent process maps
- $1.2M annual documentation costs
AutoDiagram Implementation:
- Standardized 200+ workflow diagrams
- Integrated with SAP ERP system
- AI-powered gap analysis
Results:
- 47% faster onboarding
- 63% reduction in operational errors
- ROI achieved in 5 months
7. FAQs
Q: How does AutoDiagram handle complex UML diagrams?
A: Our AI supports 9 UML diagram types with automatic relationship validation
Q: Can we import legacy Visio files?
A: Yes – 100% compatibility with .vsdx/.vssx formats
Q: What about on-premises deployment?
A: Enterprise Kubernetes package available
Q: How accurate is the AI generation?
A: 94% accuracy for technical diagrams in benchmark tests
8. Conclusion: The New Era of Intelligent Diagramming
AutoDiagram isn’t just another tool – it’s a paradigm shift:
- 10x Faster Creation: From hours to minutes
- Zero-Error Documentation: AI-powered validation
- Enterprise-Grade Collaboration: Real-time sync at scale
- Future-Proof Architecture: Continuous AI improvements
Join 15,000+ teams transforming their visual communication → Start Free Trial