Customer Journey Mapping: See Your Business Through Your Customer's Eyes

Customer Journey Mapping: See Your Business Through Your Customer's Eyes
Why do customers choose your competitor? Why do they abandon their cart? Why don't they come back?
Most businesses have no idea. They're guessing.
Customer journey mapping shows you EXACTLY what customers experience-the good, the bad, and the "why did we lose them?"
And once you see it visually, the improvements become obvious!
What Is a Customer Journey Map?
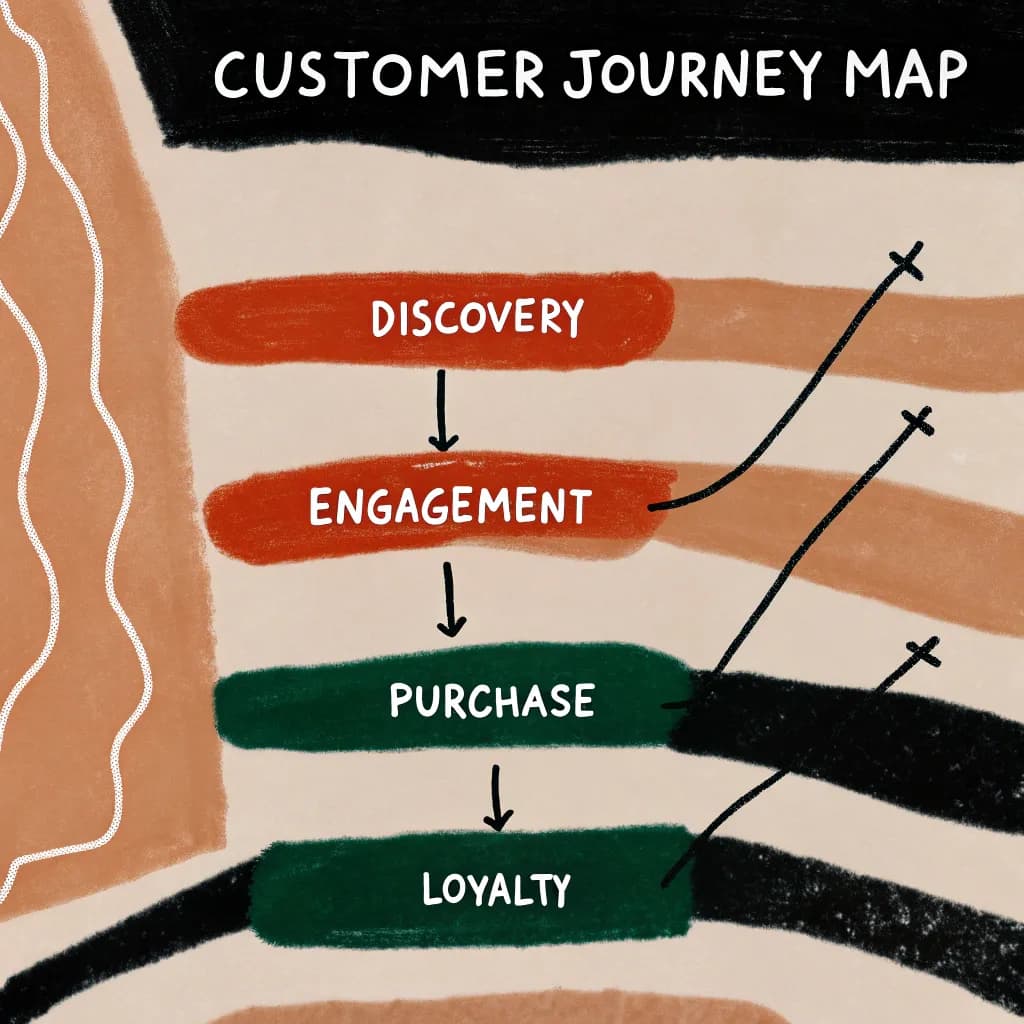
Simple definition: A visual story of every interaction a customer has with your business-from first awareness to post-purchase.
It shows:
- What they're doing at each stage
- What they're thinking and feeling
- What problems they encounter
- Where they drop off
- Opportunities to improve
Think of it like: Walking a mile in your customer's shoes, then documenting every step!
Why Customer Journey Mapping Matters
Without a journey map:
- You fix random things hoping they help
- You miss obvious pain points
- Different teams optimize their own silos
- You lose customers and don't know why
With a journey map:
- You see patterns across the entire journey
- You prioritize improvements that matter most
- Teams align around customer experience
- You know exactly where you're losing money
Real Story: The $400K Shopping Cart
An e-commerce company was losing sales. Their checkout had a 68% abandonment rate!
They tried everything:
- Redesigned the button (still high abandonment)
- Offered discounts (helped a little)
- Simplified the form (minimal impact)
Then they mapped the actual customer journey from "I want to buy" to "Purchase complete."
What they discovered:
- Forced account creation before purchase (annoying!)
- Shipping cost hidden until final step (surprise anger!)
- Mobile checkout basically broken (50% of traffic!)
- No save-for-later option (decision fatigue!)
They fixed these issues:
- Guest checkout option
- Shipping estimator early
- Mobile-optimized checkout
- Save cart feature
Result: Abandonment dropped to 32%. Additional $400K in annual revenue!
The journey map showed them exactly what to fix.
The Basic Customer Journey Stages
Typical journey stages (yours may vary):
1. Awareness: Customer realizes they have a need
2. Consideration: Researching options and solutions
3. Decision: Choosing a specific solution/vendor
4. Purchase: Actual buying experience
5. Onboarding: Initial use/setup
6. Usage: Ongoing relationship
7. Renewal/Repurchase: Coming back (or not!)
8. Advocacy: Recommending to others (or complaining!)
How to Create Your First Customer Journey Map
Step 1: Pick One Customer Segment
Don't try to map everyone at once!
Pick your most important customer type:
- First-time buyers
- Enterprise clients
- Mobile shoppers
- Subscription users
Create separate maps for different segments later!
Step 2: List All Touchpoints
Touchpoints = anywhere customer interacts with your business
Examples:
- Social media ad
- Website visit
- Email received
- Customer service call
- Product delivery
- Invoice received
- Support ticket
- Review left
List them chronologically!
Step 3: Add Customer Actions, Thoughts, Emotions
For each touchpoint, document:
Action: What are they doing?
- "Searching Google for solutions"
- "Reading product reviews"
- "Comparing prices"
Thoughts: What are they thinking?
- "Will this actually work?"
- "Is this worth the price?"
- "Can I trust this company?"
Emotions: How are they feeling?
- 😊 Excited
- 😰 Anxious
- 😡 Frustrated
- 😕 Confused
How to get this info:
- Customer interviews
- Support ticket analysis
- User testing sessions
- Survey responses
- Analytics data (where do they drop off?)
Step 4: Identify Pain Points and Opportunities
Mark on your map:
Pain Points (🔴 Red):
- Where customers struggle
- Where they get confused
- Where they abandon
- Where they complain
Opportunities (🟢 Green):
- Where you could delight customers
- Where competitors fail
- Where you could add value
- Quick wins for improvement
Step 5: Create the Visual
Format options:
Option A: Linear Timeline
[Stage 1] → [Stage 2] → [Stage 3] → [Stage 4]
Actions:   [what they do at each stage]
Thoughts:  [what they think]
Emotions:  [how they feel]
Touchpoints: [where interaction happens]
Pain Points: [🔴problems]
Opportunities: [🟢improvements]
Option B: Swim Lane Diagram
Horizontal rows for different aspects:
- Customer actions (top row)
- Touchpoints (second row)
- Emotions (third row)
- Pain points (fourth row)
Option C: Story Board Style
Visual panels like a comic strip showing customer journey step-by-step with illustrations!
Example: Coffee Shop Customer Journey
Stage 1: Awareness
- Action: Walks by coffee shop, sees sign
- Thought: "I need coffee!"
- Emotion: 😴 Tired, need energy
- Touchpoint: Storefront
Stage 2: Entry
- Action: Enters, looks at menu board
- Thought: "Too many options, what's good?"
- Emotion: 😕 Confused
- Pain Point (🔴): Menu overwhelming, hard to decide
- Opportunity (🟢): Staff recommendations, simplified menu sections
Stage 3: Ordering
- Action: Orders drink, pays
- Thought: "Did I order the right size?"
- Emotion: 😬 Slightly uncertain
- Touchpoint: Counter staff, POS system
- Opportunity (🟢): Show drink sizes visually, confirm order
Stage 4: Waiting
- Action: Waits for order
- Thought: "How long will this take?"
- Emotion: 😐 Impatient
- Pain Point (🔴): No estimated wait time
- Opportunity (🟢): Display showing order progress
Stage 5: Receiving
- Action: Gets drink, checks if correct
- Thought: "Is this what I ordered?"
- Emotion: 😊 Relieved if correct
- Touchpoint: Barista, drink
Stage 6: Experience
- Action: Tastes drink
- Thought: "This is good!" or "Not what I expected"
- Emotion: 😊 Satisfied or 😐 Disappointed
Stage 7: Leaving
- Action: Exits shop
- Thought: "Will I come back?"
- Touchpoint: Overall experience impression
Stage 8: Post-Visit
- Action: Tells friend / writes review / comes back
- Opportunity (🟢): Loyalty program, follow-up email, referral incentive
Now the coffee shop owner can see:
- Menu is confusing (simplify!)
- Wait time uncertainty (add tracker!)
- No loyalty incentive (add program!)
Digital Business Customer Journey Example
E-Learning Platform:
Awareness: Sees Facebook ad → Clicks
Consideration: Lands on website → Watches demo video → Reads reviews
Pain Point (🔴): No clear pricing information visible
Decision: Clicks "Try Free" → Signup form
Pain Point (🔴): Form asks for too much info, people abandon
Purchase: Completes signup → Redirected to dashboard
Pain Point (🔴): Dashboard confusing, no guidance on what to do first
Onboarding: Clicks random course → Starts watching
Opportunity (🟢): Could offer personalized course recommendations!
Usage: Takes courses → Completes some, abandons others
Pain Point (🔴): No progress tracking, no motivation to complete
Renewal: Free trial ends → Email about upgrading
Pain Point (🔴): Unclear what features they lose with free vs. paid
Result: Low conversion rate from free to paid
With this map, the company knows exactly what to fix:
- Add pricing page
- Simplify signup form
- Add onboarding wizard
- Implement progress tracking
- Clarify pricing tiers
The "Before and After" Journey Map Strategy
Powerful visualization technique:
Map A: Current journey (with all pain points highlighted)
Map B: Ideal journey (after improvements)
Side-by-side comparison shows the transformation!
Use this to:
- Get stakeholder buy-in
- Prioritize improvements
- Communicate vision to team
- Measure progress
Different Maps for Different Goals
B2B Customer Journey
Much longer! Includes:
- Problem awareness
- Solution research
- Vendor evaluation
- Stakeholder approval
- Contract negotiation
- Implementation
- Adoption
- Expansion
- Renewal
Key differences:
- Multiple decision-makers
- Longer timeline (months/years)
- More touchpoints with sales team
SaaS Customer Journey
Focus areas:
- Free trial experience
- Activation (getting them to use key features)
- Habit formation
- Value realization
- Expansion (upgrading plans)
- Reducing churn
Retail Customer Journey
Online + Offline touchpoints:
- Social media discovery
- Website browsing
- In-store visit
- Staff interaction
- Purchase
- Product use
- Potential return
- Repeat purchase
Using Journey Maps to Improve Your Business
Once you have your map:
1. Quick Wins: Fix obvious pain points immediately
2. Strategic Priorities: Tackle high-impact improvements
3. Team Alignment: Everyone sees the same customer experience
4. Measurement: Track improvements at each stage
5. Innovation: Discover opportunities competitors miss
Common Customer Journey Mapping Mistakes
Mistake #1: Mapping What You THINK Happens
Fix: Base it on real data! Talk to actual customers!
Mistake #2: Too Much Detail
Fix: Start high-level. Add detail where it matters most.
Mistake #3: Creating It Once and Forgetting It
Fix: Update regularly. Customer behavior changes!
Mistake #4: Only Marketing Creates It
Fix: Include sales, support, product-everyone who touches customers!
Mistake #5: Not Acting on Insights
Fix: Create action plan with owners and deadlines!
Tools for Customer Journey Mapping
Low-tech:
- Whiteboard + sticky notes
- Poster paper + markers
- Wall space + team collaboration
Digital:
- AutoDiagram (describe journey, AI creates visual)
- Miro or Mural (virtual whiteboarding)
- Specialized tools (Smaply, UXPressia)
- Simple presentation software works too!
Start simple! Fancy tool won't save a poorly researched journey map.
The "Walk the Journey" Exercise
Powerful team activity:
-
Assign team members to different customer personas
-
Actually perform the journey (sign up, buy, use product, contact support, etc.)
-
Document every friction point in real-time
-
Debrief together and create the visual map
-
Prioritize fixes as a team
Eye-opening experience! Executives who haven't used their own product in years suddenly understand customer pain!
Your Customer Journey Mapping Challenge
This week:
-
Pick one customer segment (your most important one)
-
List their journey stages from awareness to advocacy
-
For each stage, document:
- What they're doing
- What they're feeling
- Where they struggle
-
Create a simple visual (can be hand-drawn!)
-
Identify top 3 pain points to fix
-
Fix at least one this month
Repeat this process for different customer segments!
Ready to see your business through customer eyes? Use AutoDiagram to create professional customer journey maps that reveal exactly where to improve → Map Your Customer Journey
Quick FAQ
Q: How often should I update my customer journey map?
A: Review quarterly, update when you make major changes or notice shifting customer behavior.
Q: Do I need to map every single interaction?
A: No! Focus on key touchpoints. You can always add detail later.
Q: What if my customer journey is really complex?
A: Break it into smaller maps for different segments or stages. Master simple maps first!